Tracking API Latency and Errors per Endpoint for a Year With RollupDB
A small online shop runs one API with four endpoints that matter: product pages, the cart, search and checkout. The team wants a dashboard for today. They also want to answer, next spring, whether checkout got slower after the autumn release, and whether its p99 last Black Friday was worse than this one.
Request logs answer that, if you keep them. Most teams don’t keep them for a year because the bill for storing and scanning them grows every month. Monitoring tools keep the history, usually as pre-averaged numbers, and a p99 averaged across minutes isn’t the hour’s p99. RollupDB sits in between. It keeps per-endpoint counts, sums, extremes and a percentile sketch, and merges them correctly as they age.
The Stream
Two dimensions: the endpoint and the status class (2xx, 4xx, 5xx). Keep the status class coarse on purpose. Every distinct combination of dimension values is a series, and a cap on series (max_groups) stops a bug from turning user IDs or full URLs into a million of them.
{
  "name": "api_latency",
  "version": 1,
  "effective_at": "2026-01-01T00:00:00Z",
  "dimensions": ["endpoint", "status"],
  "statistics": ["count", "sum", "min", "max", "avg"],
  "max_groups": 1000,
  "tiers": [
    {"width_seconds": 1,     "retain_seconds": 3600,     "grace_seconds": 120},
    {"width_seconds": 60,    "retain_seconds": 604800,   "grace_seconds": 120},
    {"width_seconds": 3600,  "retain_seconds": 31536000, "grace_seconds": 120},
    {"width_seconds": 86400, "retain_seconds": 0,        "grace_seconds": 120}
  ],
  "sketch": {"algorithm": "kll_float64", "encoding_version": 1, "k": 200, "m": 8}
}
Seconds for an hour, minutes for a week, hours for a year, days for good. The API server posts each request’s duration to rollupdb serve on the same machine, in batches.
What It Shows
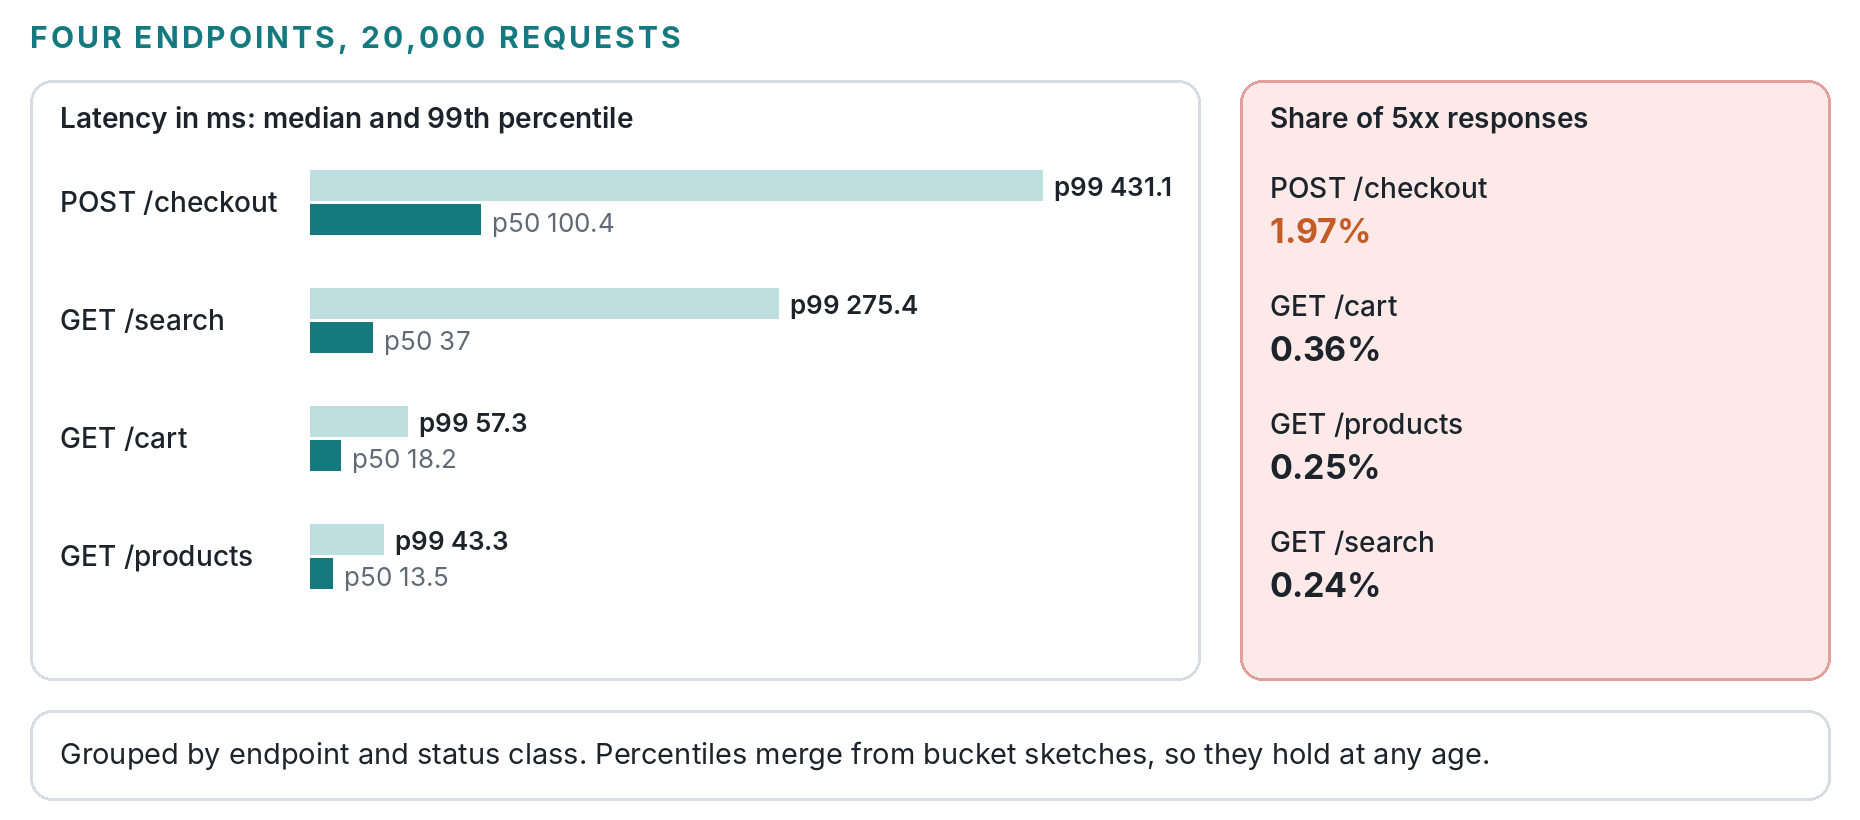
We fed the released 0.4.1 binary 20,000 simulated requests across the four endpoints, with checkout the slowest and the flakiest. Latency per endpoint, in one SQL statement:
rollupdb sql shop.rollupdb "SELECT endpoint, sum(count) AS requests,
  round(sum(sum) / sum(count), 1) AS mean_ms,
  round(rollup_quantile(sketch, 0.5), 1) AS p50_ms,
  round(rollup_quantile(sketch, 0.99), 1) AS p99_ms
  FROM api_latency GROUP BY endpoint ORDER BY p99_ms DESC"
| endpoint | requests | mean_ms | p50_ms | p99_ms |
|---|---|---|---|---|
| POST /checkout | 4834 | 118.6 | 100.4 | 431.1 |
| GET /search | 4981 | 54.3 | 37.0 | 275.4 |
| GET /cart | 5016 | 20.6 | 18.2 | 57.3 |
| GET /products | 5169 | 15.4 | 13.5 | 43.3 |
Search is the interesting one. Its mean says 54 ms and its median 37, but its p99 is seven times the median. A mean on a dashboard would hide that. The error rate comes from the same stream, since status is a dimension:
rollupdb sql shop.rollupdb "SELECT endpoint,
  sum(CASE WHEN status = '5xx' THEN count ELSE 0 END) AS errors,
  sum(count) AS requests,
  round(100.0 * sum(CASE WHEN status = '5xx' THEN count ELSE 0 END) / sum(count), 2) AS error_pct
  FROM api_latency GROUP BY endpoint ORDER BY error_pct DESC"
Checkout comes out at 1.97% (95 of 4,834), the others between 0.24% and 0.36%. Counts are exact. Percentiles are approximate, from merged KLL sketches. The error model is about rank, about 1.3% at these settings, and in a long tail a small step in rank is a big step in milliseconds: the same p99 query grouped by day instead gave search 326.1 ms. Read a p99 as a range, not a fixed number. That holds just as well for the hourly buckets a year from now: the p99 for a whole day is computed from the day’s merged sketches, not averaged from 24 hourly p99s.
Comparing Releases
Add WHERE start >= '2026-11-01T00:00:00Z' and group by substr(start, 1, 10) for a p99 per endpoint per day. Run it next spring over hourly buckets and it still works. If the question needs a breakdown you didn’t declare, such as latency per customer plan, it can’t be rebuilt from these buckets. Add the field as a dimension in a new stream from the day you need it, and keep its values few.
What It Isn’t
RollupDB isn’t a tracing tool or a log search. It won’t show you the one slow request and its stack. Keep a short window of raw logs or traces for that, a few days, and let RollupDB keep the year. The two cost very different amounts to store, and they answer different questions.