Keeping Years of Cold Room Temperatures on an IoT Gateway With RollupDB
Picture a food distributor with six cold rooms, each with a sensor that reports the temperature every second. The readings go to a small gateway in the building. Somebody will want two things from that data. Today: is any room warming up? Two years from now, during an audit or an insurance claim: what were the temperatures in room 4 last March, and how bad did it get?
Raw readings don’t fit that brief. Six sensors at one reading a second come to about 190 million readings a year, and nobody wants to keep that on a gateway or ship it all to the cloud just to answer a question once a year. What the audit needs is the coldest, the warmest, the average and the spread for each room, hour by hour. That’s what RollupDB keeps.
The Stream
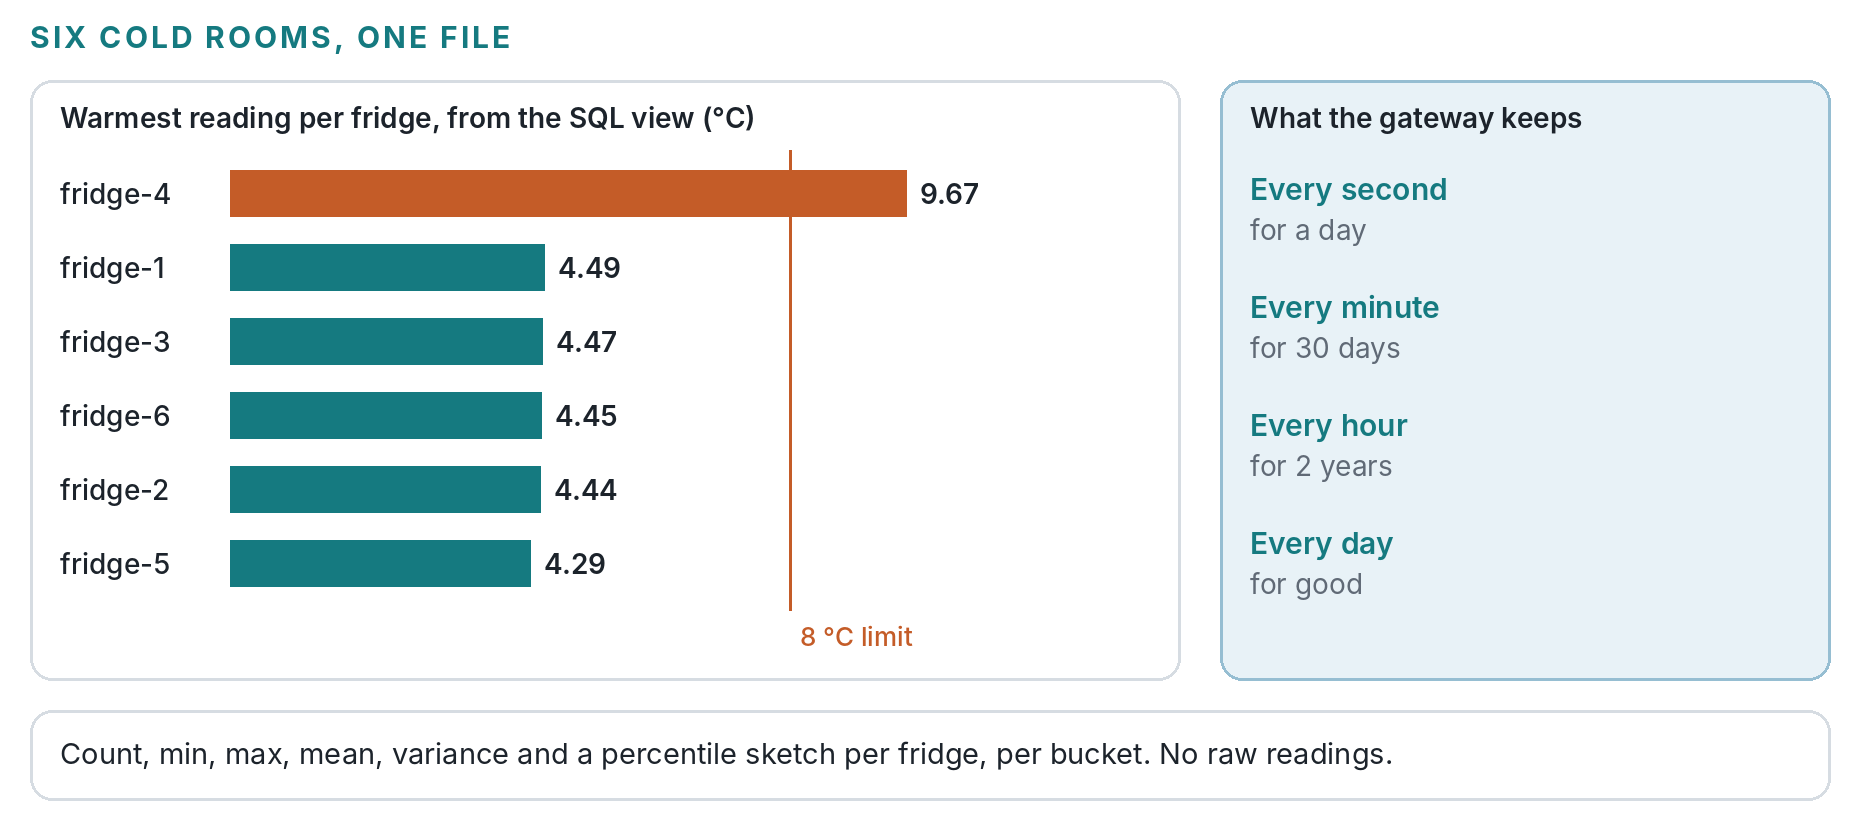
One stream, one dimension, the device. Seconds for a day, minutes for a month, hours for two years, and one bucket per day for good. Sensors on a flaky network report late now and then, so the grace window is five minutes instead of two.
{
  "name": "cold_rooms",
  "version": 1,
  "effective_at": "2026-01-01T00:00:00Z",
  "dimensions": ["device"],
  "statistics": ["count", "min", "max", "avg", "variance_sample"],
  "max_groups": 500,
  "tiers": [
    {"width_seconds": 1,     "retain_seconds": 86400,    "grace_seconds": 300},
    {"width_seconds": 60,    "retain_seconds": 2592000,  "grace_seconds": 300},
    {"width_seconds": 3600,  "retain_seconds": 63072000, "grace_seconds": 300},
    {"width_seconds": 86400, "retain_seconds": 0,        "grace_seconds": 300}
  ],
  "sketch": {"algorithm": "kll_float64", "encoding_version": 1, "k": 200, "m": 8}
}
rollupdb serve on the gateway takes the readings over HTTP on the loopback address and rolls the buckets up once a minute. Nothing else to schedule.
A Door Left Open
We ran this against the released 0.4.1 binary with a minute and a half of simulated readings: six fridges at about 3.8 °C, except fridge-4, whose door was left ajar and which drifted up the whole time. Then a reading from fridge-2 arrived 200 seconds late, and another 400 seconds late. The first went in; the second was refused and counted as late. RollupDB doesn’t quietly fold a reading into a bucket it has already closed.
Then one SQL query over the stream’s view:
rollupdb sql coldchain.rollupdb "SELECT device, sum(count) AS readings,
  min(min) AS coldest, max(max) AS warmest,
  round(sum(sum) / sum(count), 2) AS mean_c,
  round(rollup_quantile(sketch, 0.95), 2) AS p95_c
  FROM cold_rooms GROUP BY device ORDER BY warmest DESC"
| device | readings | coldest | warmest | mean_c | p95_c |
|---|---|---|---|---|---|
| fridge-4 | 90 | 3.72 | 9.67 | 6.47 | 8.93 |
| fridge-1 | 90 | 3.21 | 4.49 | 3.79 | 4.18 |
| fridge-3 | 90 | 3.12 | 4.47 | 3.81 | 4.21 |
| fridge-6 | 90 | 3.15 | 4.45 | 3.79 | 4.13 |
| fridge-2 | 91 | 3.14 | 4.44 | 3.80 | 4.10 |
| fridge-5 | 90 | 3.26 | 4.29 | 3.83 | 4.25 |
Fridge-2 has 91 readings: the late one that made it. The same query works on two-year-old hourly buckets as it does on this minute’s seconds. Coldest, warmest and mean are exact at any age. The 95th percentile comes from merged sketches, so it’s approximate, and the JSON query API says so in every answer.
How Big It Gets
The size follows how much history you keep and how many series you have, not how many readings came in. In the recorded test, five years of readings from two services took 15.4 MB, and half as many readings over the same years made a 15.3 MB file. Six fridges is more series than that, so expect more, but the same shape: it grows with time kept, not with reading rate. The test write-up has the details.
What You Give Up
You can’t ask how many minutes fridge-4 spent above 8 °C last March. That would need every reading, or a statistic you declared up front, and RollupDB keeps neither. The hourly max tells you it went over, and the percentiles show roughly how warm the bulk of that hour was. If an exact time-over-limit count matters for compliance, count excursions on the gateway as they happen and send that count as its own stream.
And the dimension is the device. If you later want temperatures by building, add the building as a dimension in a new stream from that day on. Old buckets can’t be split by a field they never kept.