What an Aggregate Database Keeps When the Raw Events Are Gone
Most databases keep what you put in. An aggregate database doesn’t. It keeps what you’ll ask about later, and only that. You tell it up front: for this stream of latencies, I want the count, the sum, the min and max, the mean, the variance and the 99th percentile, grouped by service. Then it’s free to throw the individual readings away, because it already has what those readings were going to be used for.
That sounds like a loss, and it is one, on purpose. You can’t ask a new kind of question of last March. But most telemetry is asked the same few questions for its whole life. How many, how big, how slow at the tail, and how does that compare to last month? If those are your questions, keeping every raw event for years is paying to store answers you’ll never need in a form you’ll never read.
The Catch Is in the Merging
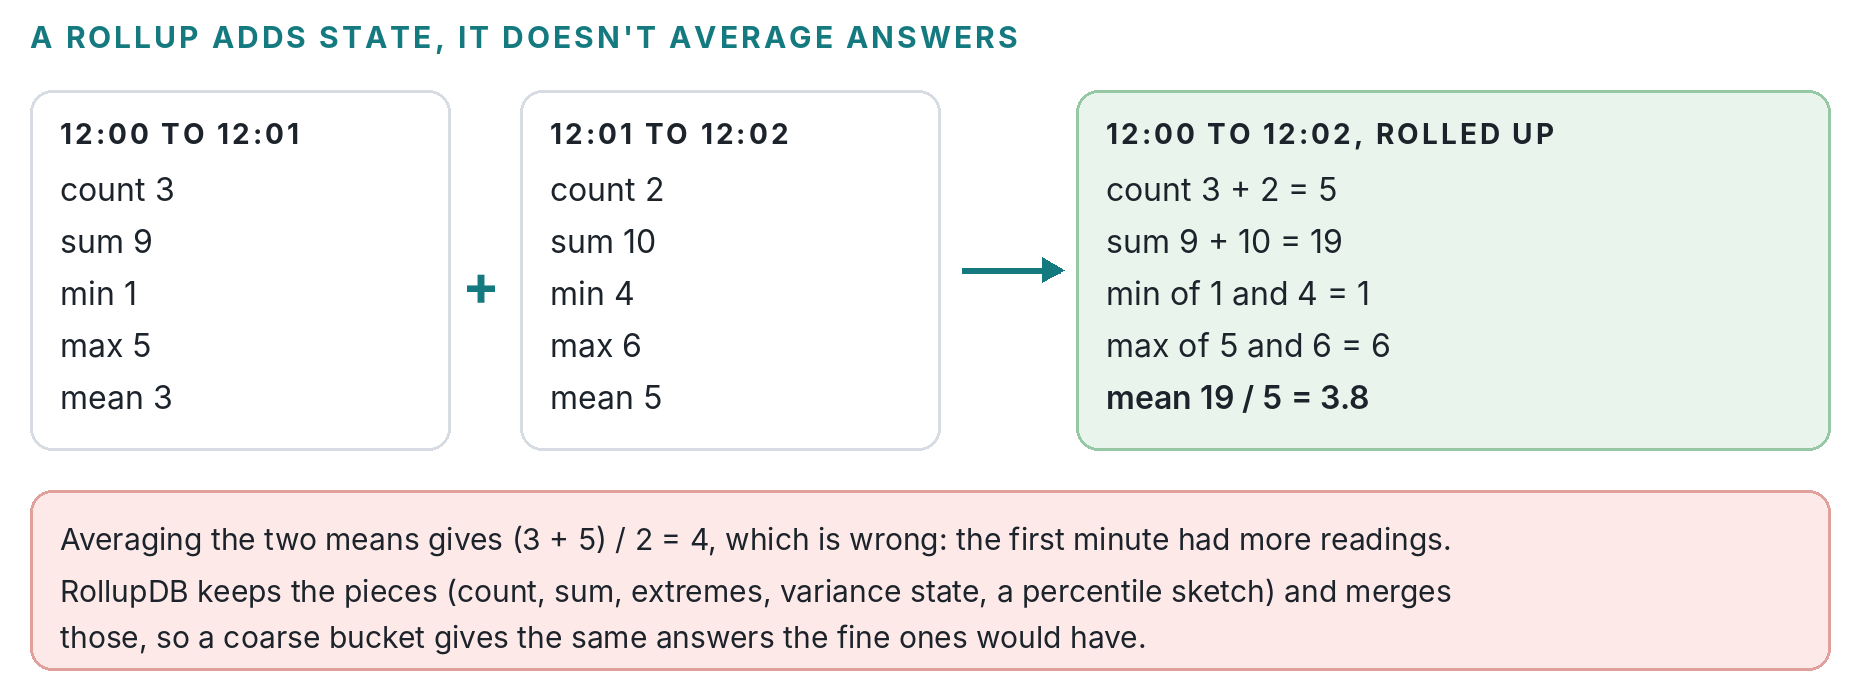
The hard part isn’t deciding to summarize. It’s summarizing so that summaries can be combined again. Say minute one had three readings with a mean of 3 and minute two had two readings with a mean of 5. The mean of the two minutes isn’t 4. It’s 3.8, because minute one counted for more. If the database had kept only the means, that 3.8 would be gone for good.
So RollupDB keeps the pieces, not the answers. Count and sum add up. Min and max take the smaller and the larger. Variance is kept as a count, a mean and a running sum of squared differences, which combine with a known formula and give the same result as if you’d computed it over every reading at once. Percentiles are the tricky one: a p99 of sixty minutes can’t be built from sixty minute-level p99s. RollupDB keeps a KLL sketch per bucket, a compact summary of the whole distribution that merges with other sketches. The percentile you get back is an estimate, and it comes with its error model.
Fine When It’s Fresh, Coarse When It’s Old
With mergeable buckets, aging data becomes bookkeeping. A stream declares its tiers, say one-second buckets kept for an hour, minute buckets kept for a week, hourly ones for a year and daily ones forever. When you run advance, buckets that are old enough fold into the next tier and the fine copies go. A day bucket then answers exactly like the 86,400 seconds it came from, for every statistic except the percentiles, which stay within the sketch’s error.
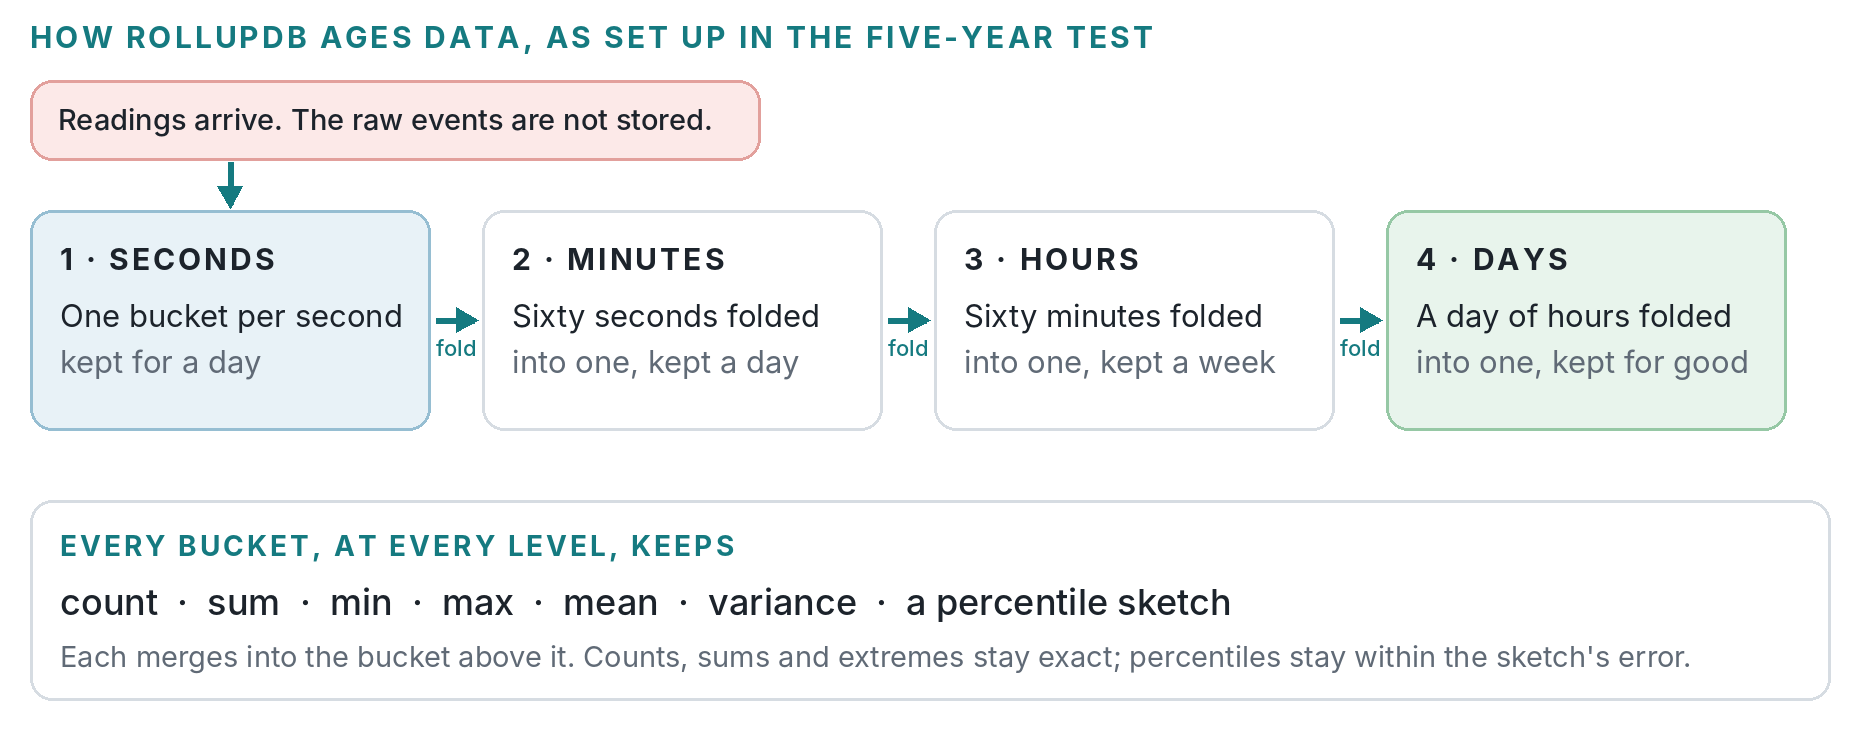
That’s why the file size tracks the shape of the history, not the volume. In the recorded five-year test, doubling the readings grew the file by 0.37%. What does grow it is more series to keep apart: more services, more devices, more combinations of the dimensions you group by. RollupDB caps those per stream, and refuses and counts readings past the cap, so one runaway label can’t blow up the file.
What It Asks of You
You decide what to keep before the data arrives, and RollupDB holds you to it. Readings later than a bucket’s grace window are refused and counted, not slipped into some other bucket. A query that cuts through the middle of a coarse bucket is refused rather than guessed. And every answer says which resolutions it used and what it couldn’t cover, so a month-old chart never pretends to second-level detail.
If that trade fits your data, the quick start shows it end to end, and the reference has the details.